I've written before about Google Drawings as a simple, yet effective way to create graphics (including existing images, shapes, text, and more). Here are two more tips:
When you insert a Drawing into a Doc, then later edit the drawing, you can click the drawing in the doc and choose "Update" to get the latest version.
A more advanced tip is that you can create "hot spots" in a Google Drawing that you place on a . This means you can make certain regions in the drawing clickable. The trick is to put a shape on the top layer of the drawing, making both its fill and outline transparent. With the shape still selected, insert a hyperlink. You can then embed the drawing in a Google site and the image will be clickable.
Here's an example of that.
Showing posts with label google drawing. Show all posts
Showing posts with label google drawing. Show all posts
Monday, March 25, 2019


Tuesday, December 4, 2018
Making graphics with Google Drawings
I was working with a teacher recently on creating illustrated text, to help students "see" what words meant. We came up with this, for example:
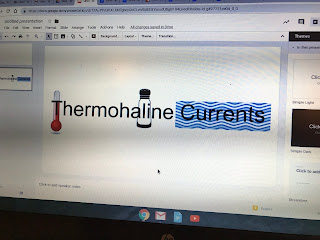 The tool we used was Google Drawings. While there are many tools available for graphics, Google Drawings is a great choice for combining images, text, shapes, and more. It's also effective for making diagrams, such as flowcharts, where lines connecting shapes move along with their shapes.
Here's a graphic I made to demonstrate...

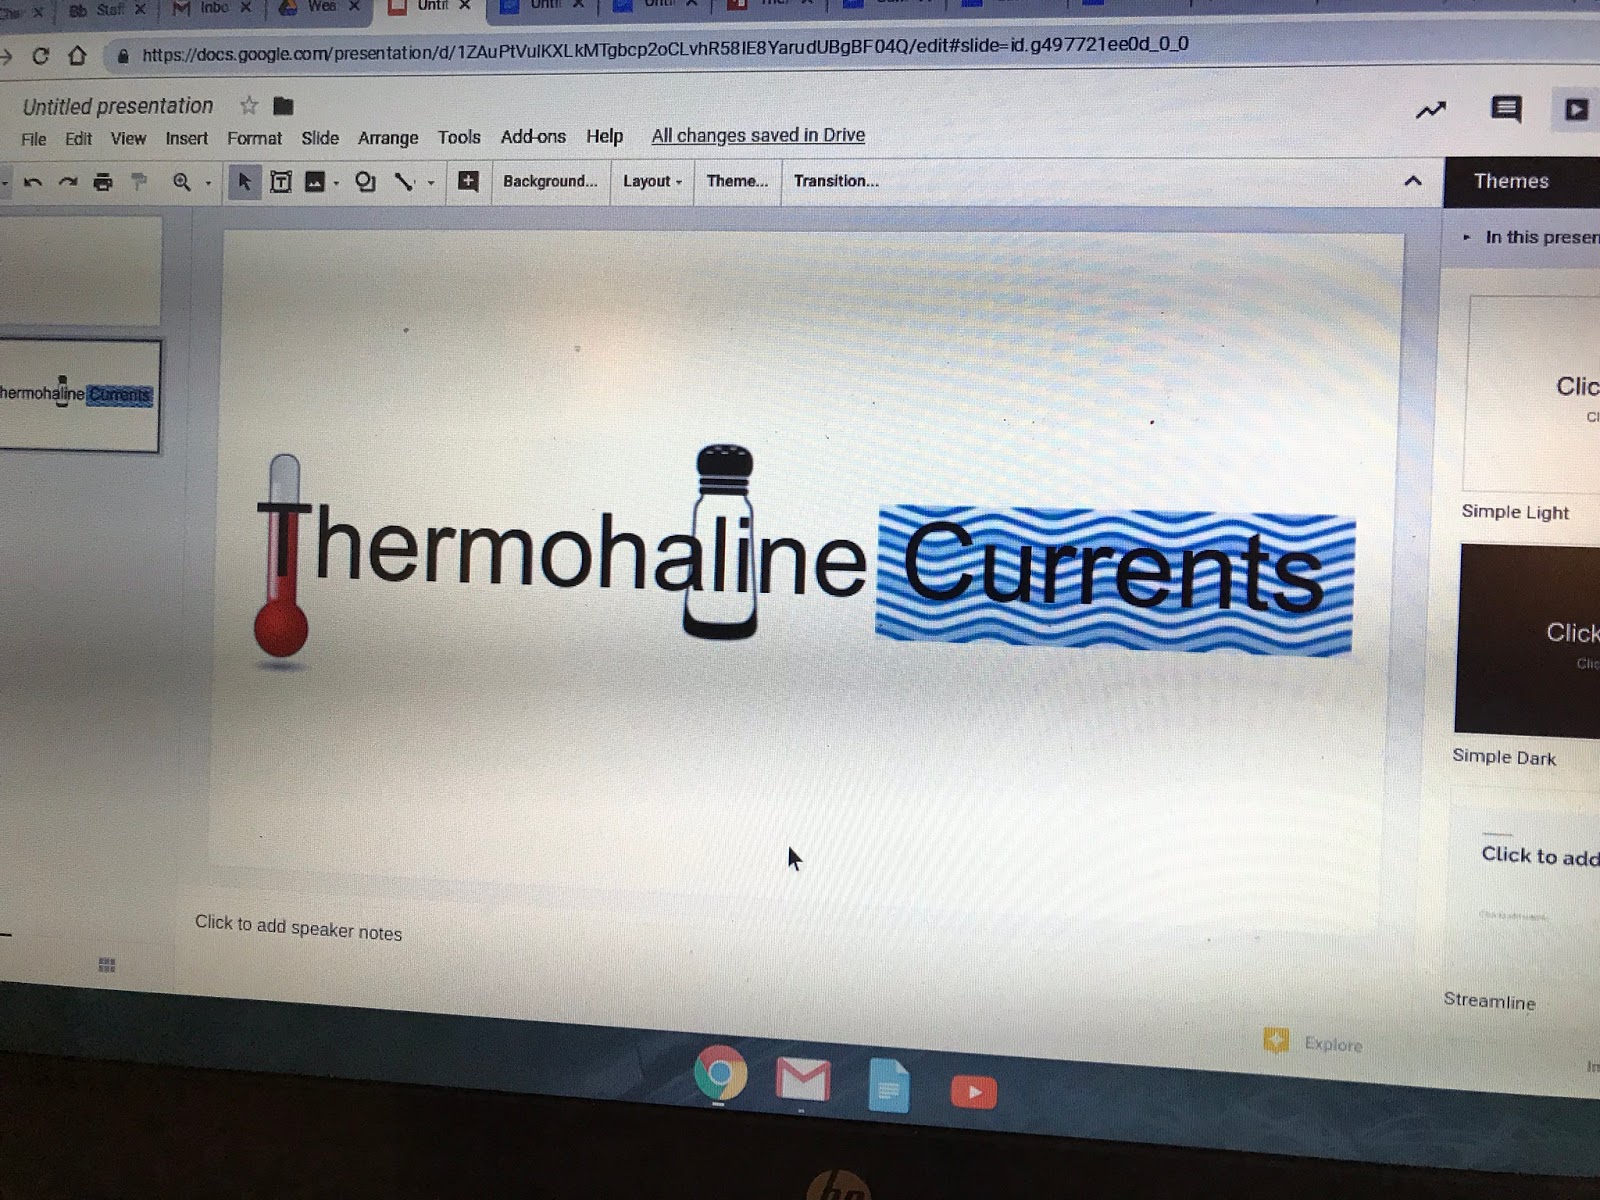
Here's a graphic I made to demonstrate...

...and a screencast on how to use Google Drawings (showing how I made the image above).
Friday, November 9, 2018
Auto Draw
How good an illustrator are you? If, like me, you're not exactly an expert at drawing, you may want to check out https://www.autodraw.com/. AutoDraw is an AI experiment that tries to guess what you're drawing as you're making shapes. It will offer suggesestions. Once it comes up with what you were trying to render, you can choose it from the list.
For example, here's a picture I drew of an apple and a coffee mug.
 But...that's not really what I drew. Rather, I drew a rough sketch of each, then let AutoDraw guess what I was looking for.
 It's not perfect. But it's fun to try and could come in handy if you need to make a drawing and can't find the shape in your graphics software.
Note-- if you're a student, you should also take one of our art classes!
For example, here's a picture I drew of an apple and a coffee mug.


Note-- if you're a student, you should also take one of our art classes!
Tuesday, January 30, 2018
Tools for creating graphic organizers
Need to make a flowchart, mind map, Venn diagram, etc? Below are two tools you can use-- LucidChart and Google Drawings.
Before getting to the tools, there are a few basic concepts that are important to understand when using this kind of software:
- There are multiple layers on the canvas. You can change the order of shapes on the canvas, sending one shape in front of or behind another, or bringing a shape all the way to the front or back.
- You can group shapes together so they are treated as a single entity (to move them all at once, for example). You can also "ungroup" shapes to edit them individually.
- These and other options are usually available by simply double-clicking or right-clicking a shape.
- As you drag shapes around the canvas, guidelines will pop up that allow you to align them with other shapes and with the canvas itself (e.g., to center the shape).
- Exporting the file in png format will typically give you an image without a background (i.e., the white space will be transparent), which is useful when you'll be placing the image in front of a non-white background (see below).

LucidChart
LucidChart (from the same company that brings us LucidPress) is the more powerful of the two. It makes all kinds of different graphics. You can control all kinds of details. You can log in with your cvsdvt Google account. You can also go to Google Drive, click New...More and choose LucidChart (which will save your document in Drive).

There are lots of templates to start with

Drag shapes onto the canvas, click and drag from one shape to another to make connections (that stay connected even when you move the shapes).
You can export the final product as an image to insert into a text document or presentation. You can also import a data file with which to create your graphic.
Here are some diagrams made with LucidChart, to give you an idea:


Google Drawings
Drawings are part of G Suite (formerly Google Apps for Education). Go to Google Drive, click New...Drawing. Google Drawings is less sophisticated than some other tools, but it is simple to use. You can connect shapes with lines/arrows and they stay "attached" as you move the shapes. You may find that the canvas provided is too small; click on the lower right corner to expand it.

Note that you can also create a Google Drawing from within a Google Doc by using the Insert menu.
Wednesday, October 31, 2012
Exam Review
(Originally posted 1/10/11)
Here are two ways that technology can help you and your students prepare for exams:
1) Quizlet is a great site for making on-line flashcards. You can make a flashcard set as a class, students can make their own, or search the site for sets from other users. Quizlet offers various ways to practice, as well.
2) For the bigger picture, consider using Google Drawing to make mind map diagrams. Go to Google docs, Create New..Drawing, then just drag in shapes, double-click to add text, and connect shapes with arrows. Here's one I'm working on for my class. Of course, since it's Google, you can make changes and not have to re-share (just remember to set the sharing settings to "Anyone with the link" so students can access).
3) From Mark P:
Here are two ways that technology can help you and your students prepare for exams:
1) Quizlet is a great site for making on-line flashcards. You can make a flashcard set as a class, students can make their own, or search the site for sets from other users. Quizlet offers various ways to practice, as well.
2) For the bigger picture, consider using Google Drawing to make mind map diagrams. Go to Google docs, Create New..Drawing, then just drag in shapes, double-click to add text, and connect shapes with arrows. Here's one I'm working on for my class. Of course, since it's Google, you can make changes and not have to re-share (just remember to set the sharing settings to "Anyone with the link" so students can access).
3) From Mark P:
I found this online version of Jeopardy. You don't have to register (in
fact if you do, you'll have to pay $$) and it stays online so you can
access it anywhere. Quick and easy to set up and even helps you keep
track of team points.
4) Joe G shared this "Who Wants To Be a Millionaire"- type game that a student created for Grammar Fest:
http://www.quia.com/rr/793387.html
Quia has templates for other types of games, as well. A one-year subscription for teachers is $49- not free, but not too bad.
http://www.quia.com/rr/793387.html
Quia has templates for other types of games, as well. A one-year subscription for teachers is $49- not free, but not too bad.
Subscribe to:
Posts (Atom)