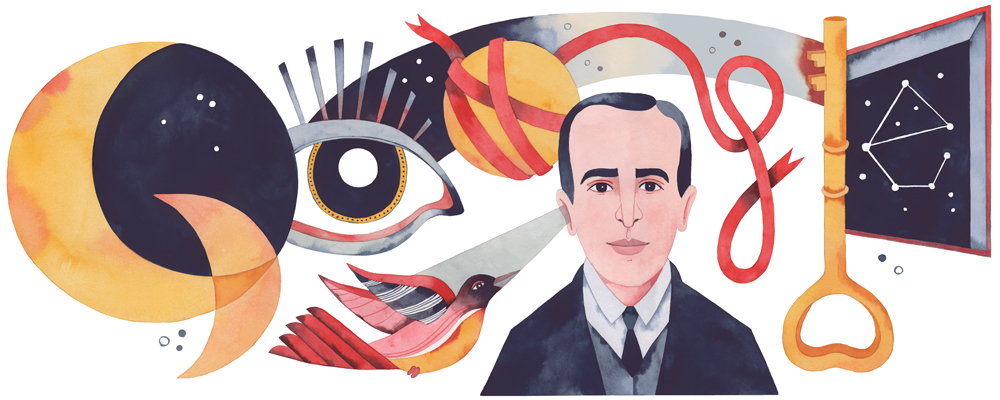
Each year, Google hosts a contest for K-12 students to create a "Doodle" for their homepage. As Google describes them, "Doodles are the fun, surprising, and sometimes spontaneous changes that are made to the Google logo to celebrate holidays, anniversaries, and the lives of famous artists, pioneers, and scientists." Today's doodle, for example, "celebrates avant-garde Chilean poet and writer Vicente Huidobro on his 127th birthday."
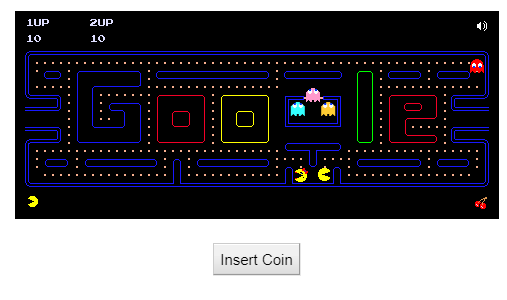
One of the most famous Google Doodles was a fully functional PacMan game
The theme for this year's student contest is "I show kindness by..." Interested students can enter by March 13th. All the information is at https://doodles.google.com/d4g
Showing posts with label graphic. Show all posts
Friday, January 10, 2020
Wednesday, November 20, 2019
Slides from Vermont Fest
I was at the Vermont Fest ed tech conference last week. Here are some themes that I took away from it:
I also wanted to share the slides from my own presentation about using screencasting. Thank you to Amy Wardwell, Olaf Verdonk, and Nicole Gorman for their contributions. Note that some of the examples may not play because they are not publically shared.
Oh, and here's a nice site I learned about (from watching a keynote speaker use it)-- https://www.flaticon.com/. Lots of free icons to use in your presentations (attribution required if you have a free account). I'm a big fan of icons over realistic photos when you want to present a general image over a specific one.
For example, consider this image of a student (from Pixabay.com)
versus this one
They're both compelling, but the icon perhaps better represents "all thinkers."
- A big emphasis on creativity, both high- and low-tech.
- Personalization
- A need to rethink how we do professional development in schools
- A real movement towards getting more computer science and coding in the curriculum. Speaking of which...I hope you saw my last post about Hour of Code.
I also wanted to share the slides from my own presentation about using screencasting. Thank you to Amy Wardwell, Olaf Verdonk, and Nicole Gorman for their contributions. Note that some of the examples may not play because they are not publically shared.
Oh, and here's a nice site I learned about (from watching a keynote speaker use it)-- https://www.flaticon.com/. Lots of free icons to use in your presentations (attribution required if you have a free account). I'm a big fan of icons over realistic photos when you want to present a general image over a specific one.
For example, consider this image of a student (from Pixabay.com)
versus this one
Icon made by Smashicons from www.flaticon.com
They're both compelling, but the icon perhaps better represents "all thinkers."
Monday, January 28, 2019
Making charts in Canva
Canva is a great tool for generating graphics-- everything from logos to posters to infographics. I was just using it today and noticed the new Charts feature. What's great about it is that you can edit the data (unlike some graphics app, where a chart is really just an image of a chart).
Here's a screenshot of a bar chart creation:
Give it a try! As always, I'm happy to help.
Here's a screenshot of a bar chart creation:
Give it a try! As always, I'm happy to help.
Labels:
digital poster,
graphic,
infographic,
poster,
visualization
Thursday, January 17, 2019
Doodle for Google contest
Ever wonder where Google gets their "Doodles" (the graphics that play on the Google logo) from? Well, sometimes it's from students. Once a year, Google holds a contest for students in grades K-12. This year's theme is "When I grow up, I hope..."
Why not share this with your students and give them a shot? There are categories for grade levels 8-9 and 10-12. Their are great prizes, including college scholarships and a visit to Google headquarters.
Tuesday, December 4, 2018
Making graphics with Google Drawings
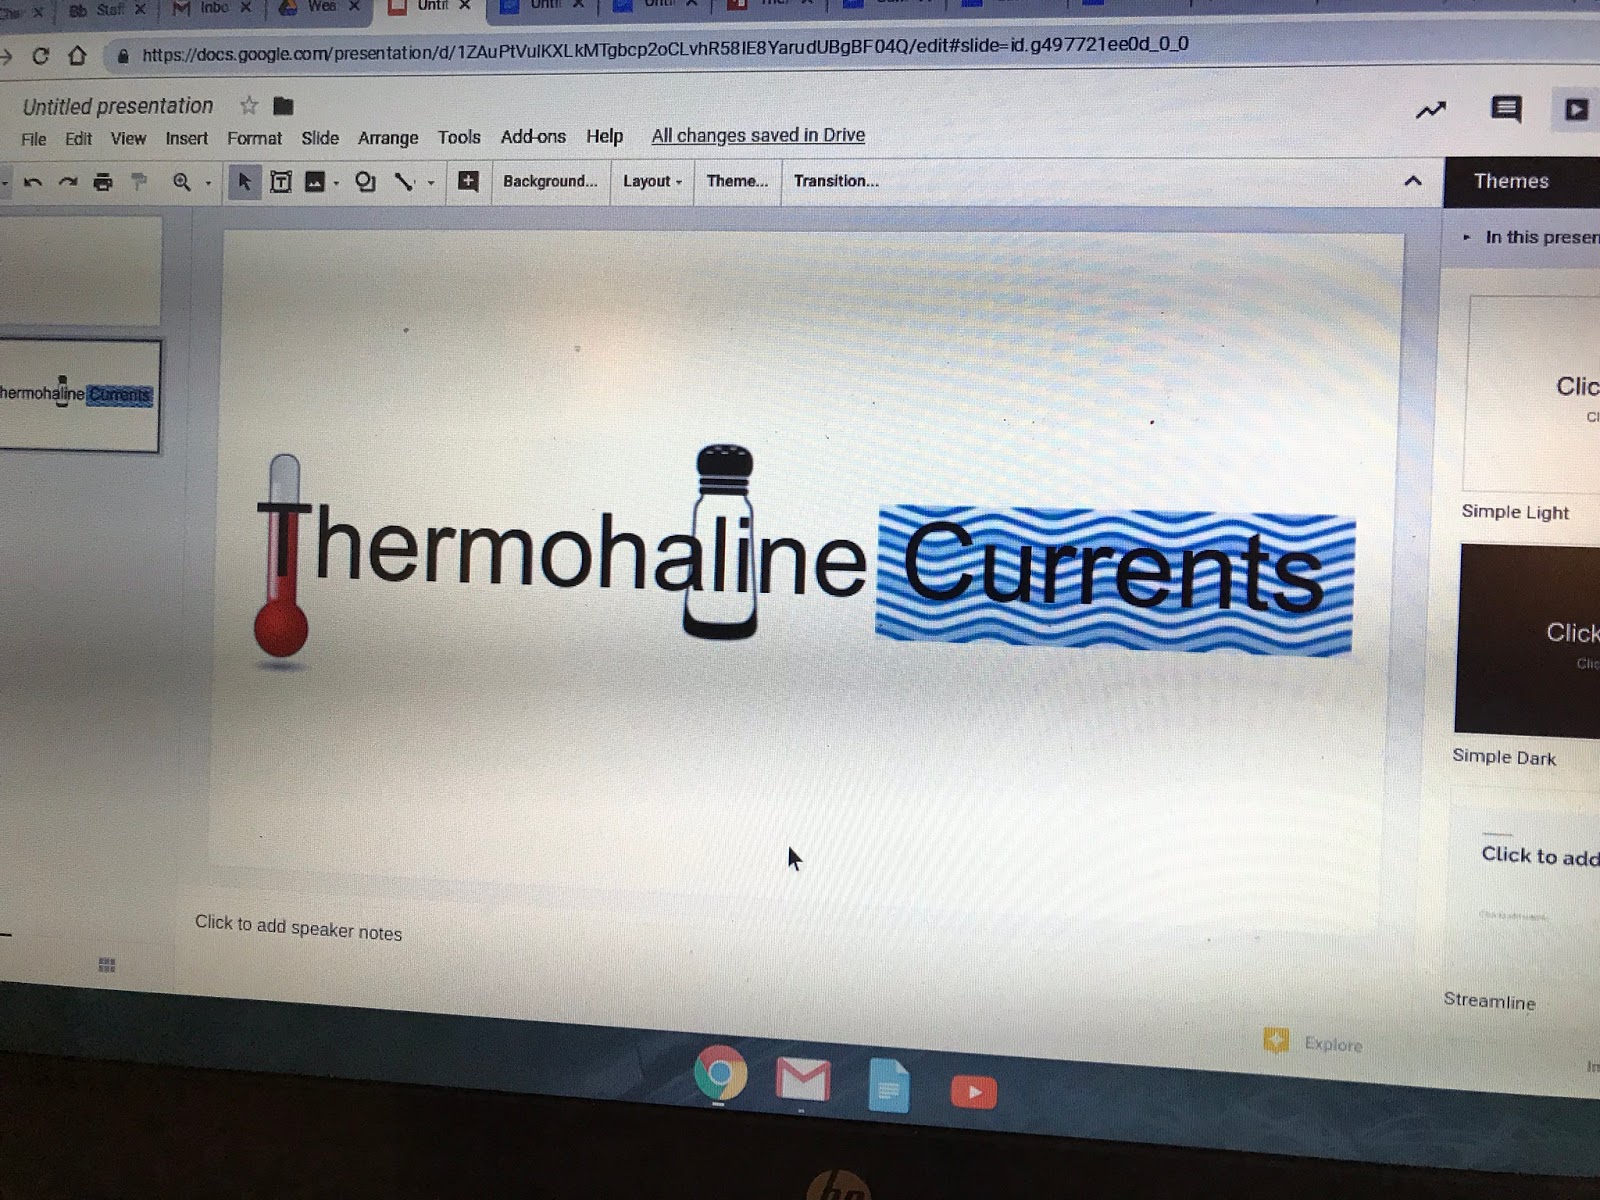
I was working with a teacher recently on creating illustrated text, to help students "see" what words meant. We came up with this, for example:
The tool we used was Google Drawings. While there are many tools available for graphics, Google Drawings is a great choice for combining images, text, shapes, and more. It's also effective for making diagrams, such as flowcharts, where lines connecting shapes move along with their shapes.
Here's a graphic I made to demonstrate...
The tool we used was Google Drawings. While there are many tools available for graphics, Google Drawings is a great choice for combining images, text, shapes, and more. It's also effective for making diagrams, such as flowcharts, where lines connecting shapes move along with their shapes.
Here's a graphic I made to demonstrate...
...and a screencast on how to use Google Drawings (showing how I made the image above).
Labels:
google drawing,
graphic,
image
Friday, November 9, 2018
Auto Draw
How good an illustrator are you? If, like me, you're not exactly an expert at drawing, you may want to check out https://www.autodraw.com/. AutoDraw is an AI experiment that tries to guess what you're drawing as you're making shapes. It will offer suggesestions. Once it comes up with what you were trying to render, you can choose it from the list.
For example, here's a picture I drew of an apple and a coffee mug.
But...that's not really what I drew. Rather, I drew a rough sketch of each, then let AutoDraw guess what I was looking for.
It's not perfect. But it's fun to try and could come in handy if you need to make a drawing and can't find the shape in your graphics software.
Note-- if you're a student, you should also take one of our art classes!
For example, here's a picture I drew of an apple and a coffee mug.
But...that's not really what I drew. Rather, I drew a rough sketch of each, then let AutoDraw guess what I was looking for.
Note-- if you're a student, you should also take one of our art classes!
Labels:
art,
google drawing,
graphic
Tuesday, September 11, 2018
Adobe Spark Accounts
Interested in using Adobe Spark with your students?
To get the premium features, your students will need to have accounts created. Because account creation generates an email, it's best to have this done moments before you introduce Spark for the first time.
Here's the process:
To get the premium features, your students will need to have accounts created. Because account creation generates an email, it's best to have this done moments before you introduce Spark for the first time.
Here's the process:
- A few days before introducing Spark, let me (Charlie) know, so I can get the accounts ready.
- When you are ready to begin, I will activate the accounts, triggering an email to the students.
- Begin getting creative with Spark!
Labels:
adobe,
graphic,
infographic,
spark
Subscribe to:
Posts (Atom)